In this article we will look at one of the cases where our customers ask for technical support. The situation is as follows: the server runs specific software, for example for calculating data cubes, which works intensively with the database. At some point, the productivity of the software drops. The customer believes that the problem is in the server's disk subsystem and contacts Cloud4U technical support for a diagnosis.
The test begins on our side: the engineers analyse the total load, including the storage and utilisation of the resources allocated to it. When it is clear that there are no problems "outside", they start diagnosing "inside" the VMs. We will explain this below.
The logic of the method is quite simple: run a few rounds of measurements. The first with a real workload, the second with and without a test load. This will allow you, firstly, to get the iops benchmarks at maximum disk subsystem load with tests and at idle. And secondly, to compare them with the performance metrics obtained under real workload.
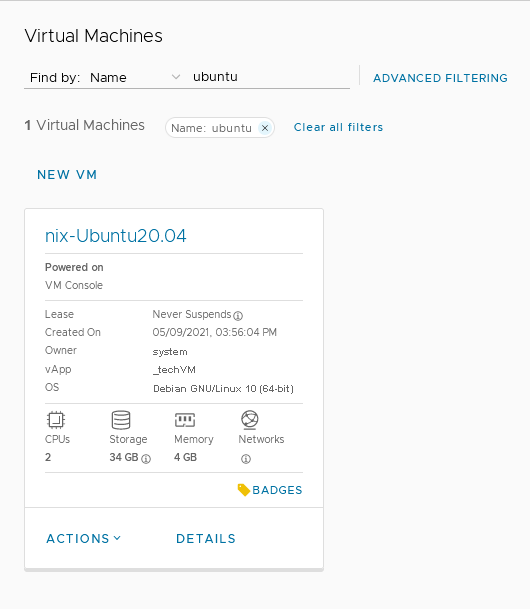
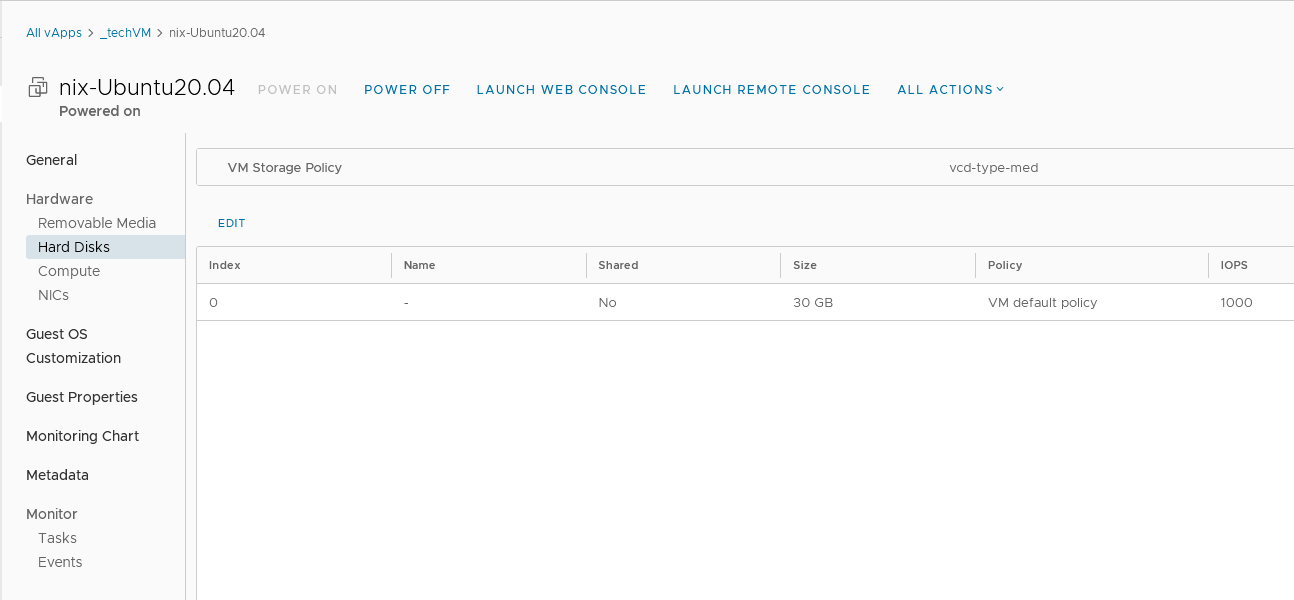
To demonstrate the diagnostic method, we set up a test in the form of a virtual machine based on Ubuntu 20.04 x64, 2 CPU cores, 4 GB memory, 30 GB disk with a vcd-type-med profile - a limit of 1000 iops.
The industry standard for checking iops on *nix systems is the iostat utility from the SYSSTAT package, and load testing is done with the fio utility - they must be installed:
sudo apt update

sudo apt install sysstat

sudo apt install fio
After installation, run the first round of measurements under real load for at least 10 minutes, for example:
iostat -x -t -o JSON 10 60 > "iostat-1.json"
The iostat parameters mean that 60 measurements are taken with an interval of 10 seconds, with the output in json format sent to the file iostat-<#_round>.json. You can set the number and intervals yourself - in one case we took measurements all day with an hourly breakdown.
As for the json format, it is much easier to process it later with software than to parse the utility output with regexp, but it is only supported in fairly recent versions - 12.x - and if you have a very old guest OS, such as Ubuntu 16.04 or lower, you will probably have to build the package from source.
In the second round, turn off the running load and turn on the measurements
iostat -x -t -o JSON 10 60 > "iostat-2.json"
and several times within 10 minutes of iostat running, turn on the test load with fio for 1-2 minutes:
fio --rate_iops=700,300, --bs=4k --rw=randrw --percentage_random=50 --rwmixread=70 --rwmixwrite=30 --direct=1 --iodepth=256 --time_based --group_reporting --name=iops-test-job --numjobs=1 --filename=runfio.sh.test --size=1GB --ioengine=libaio --runtime=60 --eta-newline=10
The parameter --rate_iops=700,300 is specified in the format --rate_iops=[read],[write],[trim] and means "give 700 iops for read, 300 for write, leave trim as default". The numbers are chosen based on the total iops limit specified in Cloud Director for a particular disk and a load distribution of 70% read / 30% write. In the case of the test bed, the total limit is 1000 iops, so the load is distributed as 700/300.
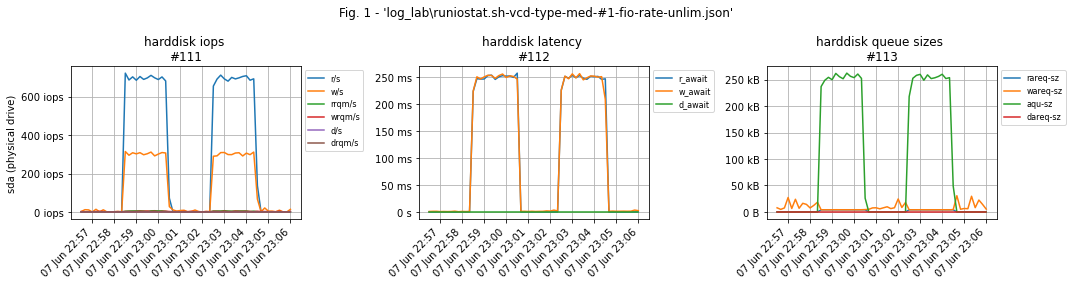
An important nuance: if you do not limit the load, fio will generate as many IOs as possible, which will cause the latency of virtual disk IOs to increase many times in the test due to vSphere's throttling of "unnecessary" operations: The VM will constantly try to do more IOs than it should, while vSphere will adjust the queue depth to hold the 'extra' operations before sending them to storage to stay within the limit.
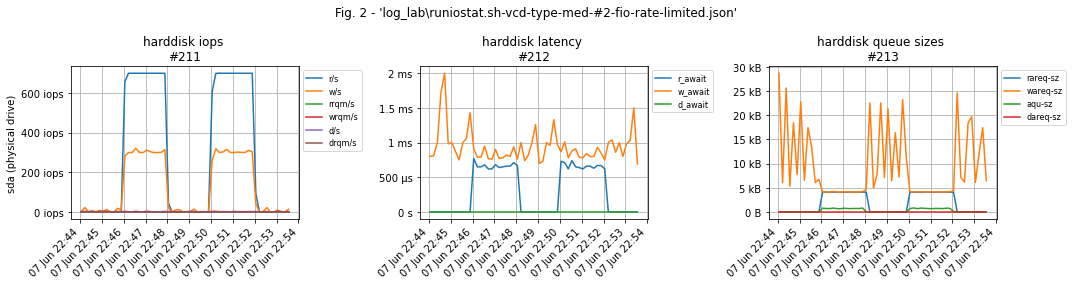
Both tests confirm that the disk works for 1000 IOs, but in the first case without --rate_iops=W,R we get throttling latency and in the second we get real values.
For latency checking you can use a separate utility, ioping:
# installation
$ sudo apt-get install ioping
# check
$ ioping -c 9 /tmp/
4 KiB <<< /tmp/ (ext4 /dev/sda5): request=1 time=309.1 us (warmup)
4 KiB <<< /tmp/ (ext4 /dev/sda5): request=2 time=717.3 us
4 KiB <<< /tmp/ (ext4 /dev/sda5): request=3 time=583.4 us
4 KiB <<< /tmp/ (ext4 /dev/sda5): request=4 time=430.2 us
4 KiB <<< /tmp/ (ext4 /dev/sda5): request=5 time=405.8 us
4 KiB <<< /tmp/ (ext4 /dev/sda5): request=6 time=387.4 us
4 KiB <<< /tmp/ (ext4 /dev/sda5): request=7 time=382.1 us (fast)
4 KiB <<< /tmp/ (ext4 /dev/sda5): request=8 time=811.6 us (slow)
4 KiB <<< /tmp/ (ext4 /dev/sda5): request=9 time=706.9 us
--- /tmp/ (ext4 /dev/sda5) ioping statistics ---
8 requests completed in 4.42 ms, 32 KiB read, 1.81 k iops, 7.06 MiB/s
generated 9 requests in 8.00 s, 36 KiB, 1 iops, 4.50 KiB/s
min/avg/max/mdev = 382.1 us / 553.1 us / 811.6 us / 162.7 us
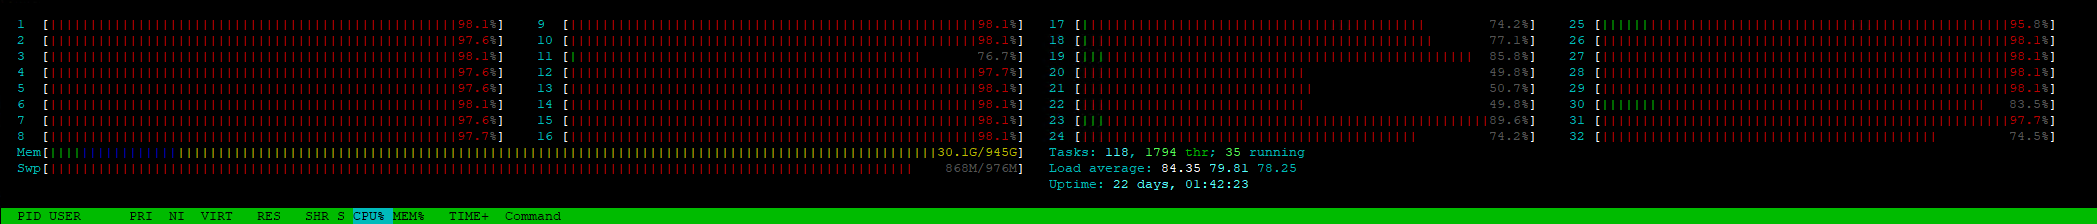
We also recommend taking screenshots of the top / htop, especially for the 1st round. The LA (Load Average) information can help find possible reasons for slow software performance. Also, if you have multiple disks or LVM, the commands lsblk -f/ls -l /dev/mapper will visualise the structure of your disk subsystem.
The processing and visualisation of the json files of the measurements was done in Python in the JupyterLab environment, using the pandas and matplotlib libraries. You can use our variant or write your own - we have prepared an archive with sources and an example of processing measurements in the form of - ipynb - jupiter-notepad.
In the end, you will be able to use the graphs to either definitely rule out problems with the disk subsystem, optimise it, or sensibly change the disk policy to a more productive one.
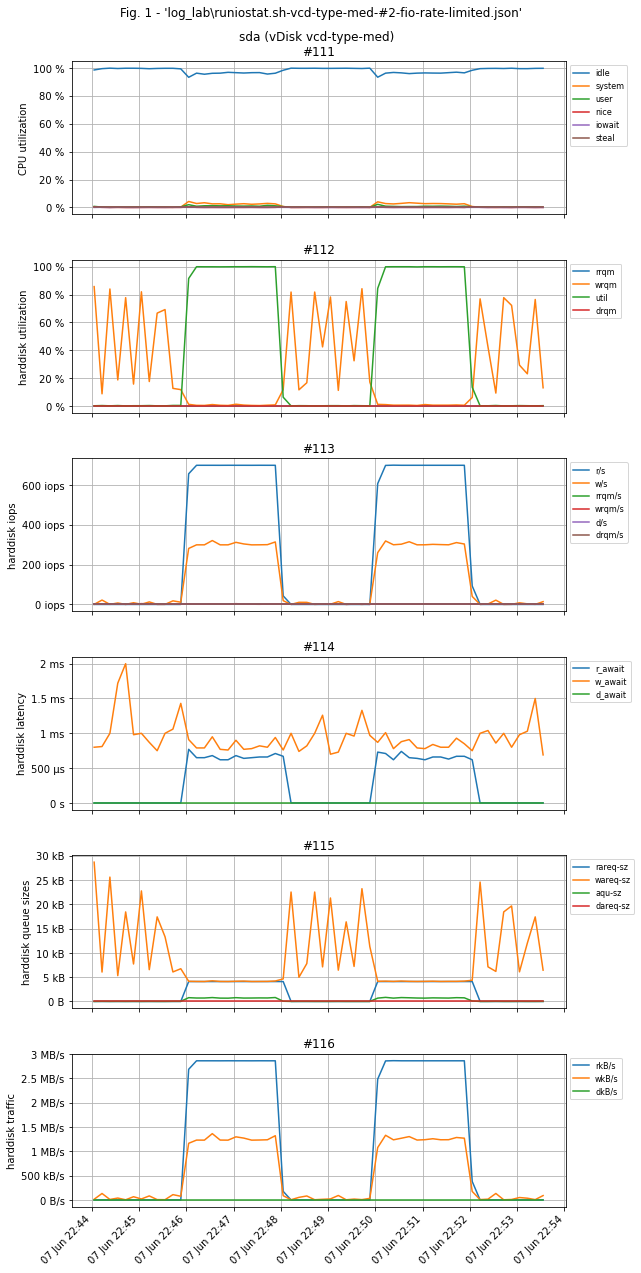
Example of test bench graphs. Test load on the graphs: 700 iops per read and 300 per write. For obvious reasons there are no workload graphs.
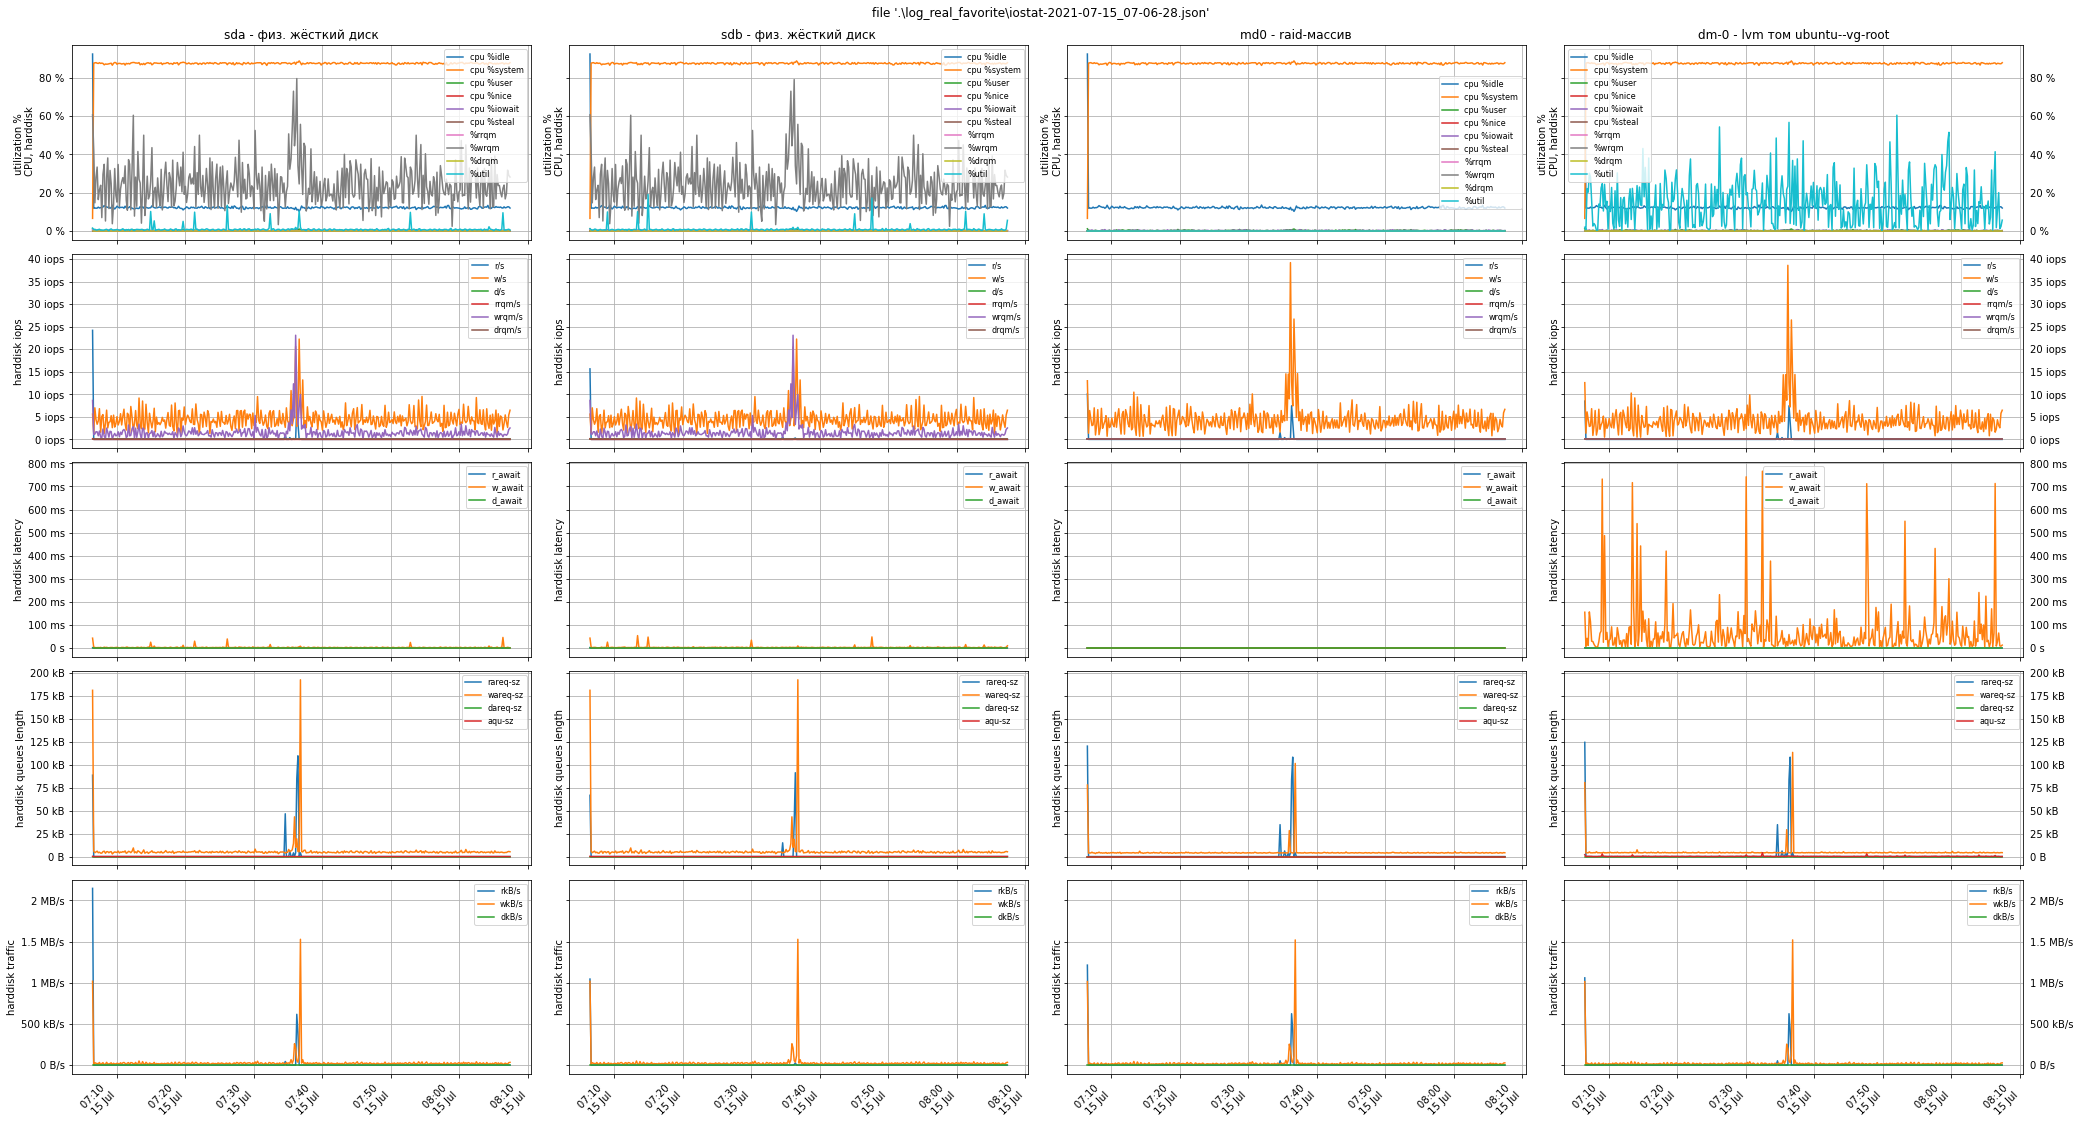
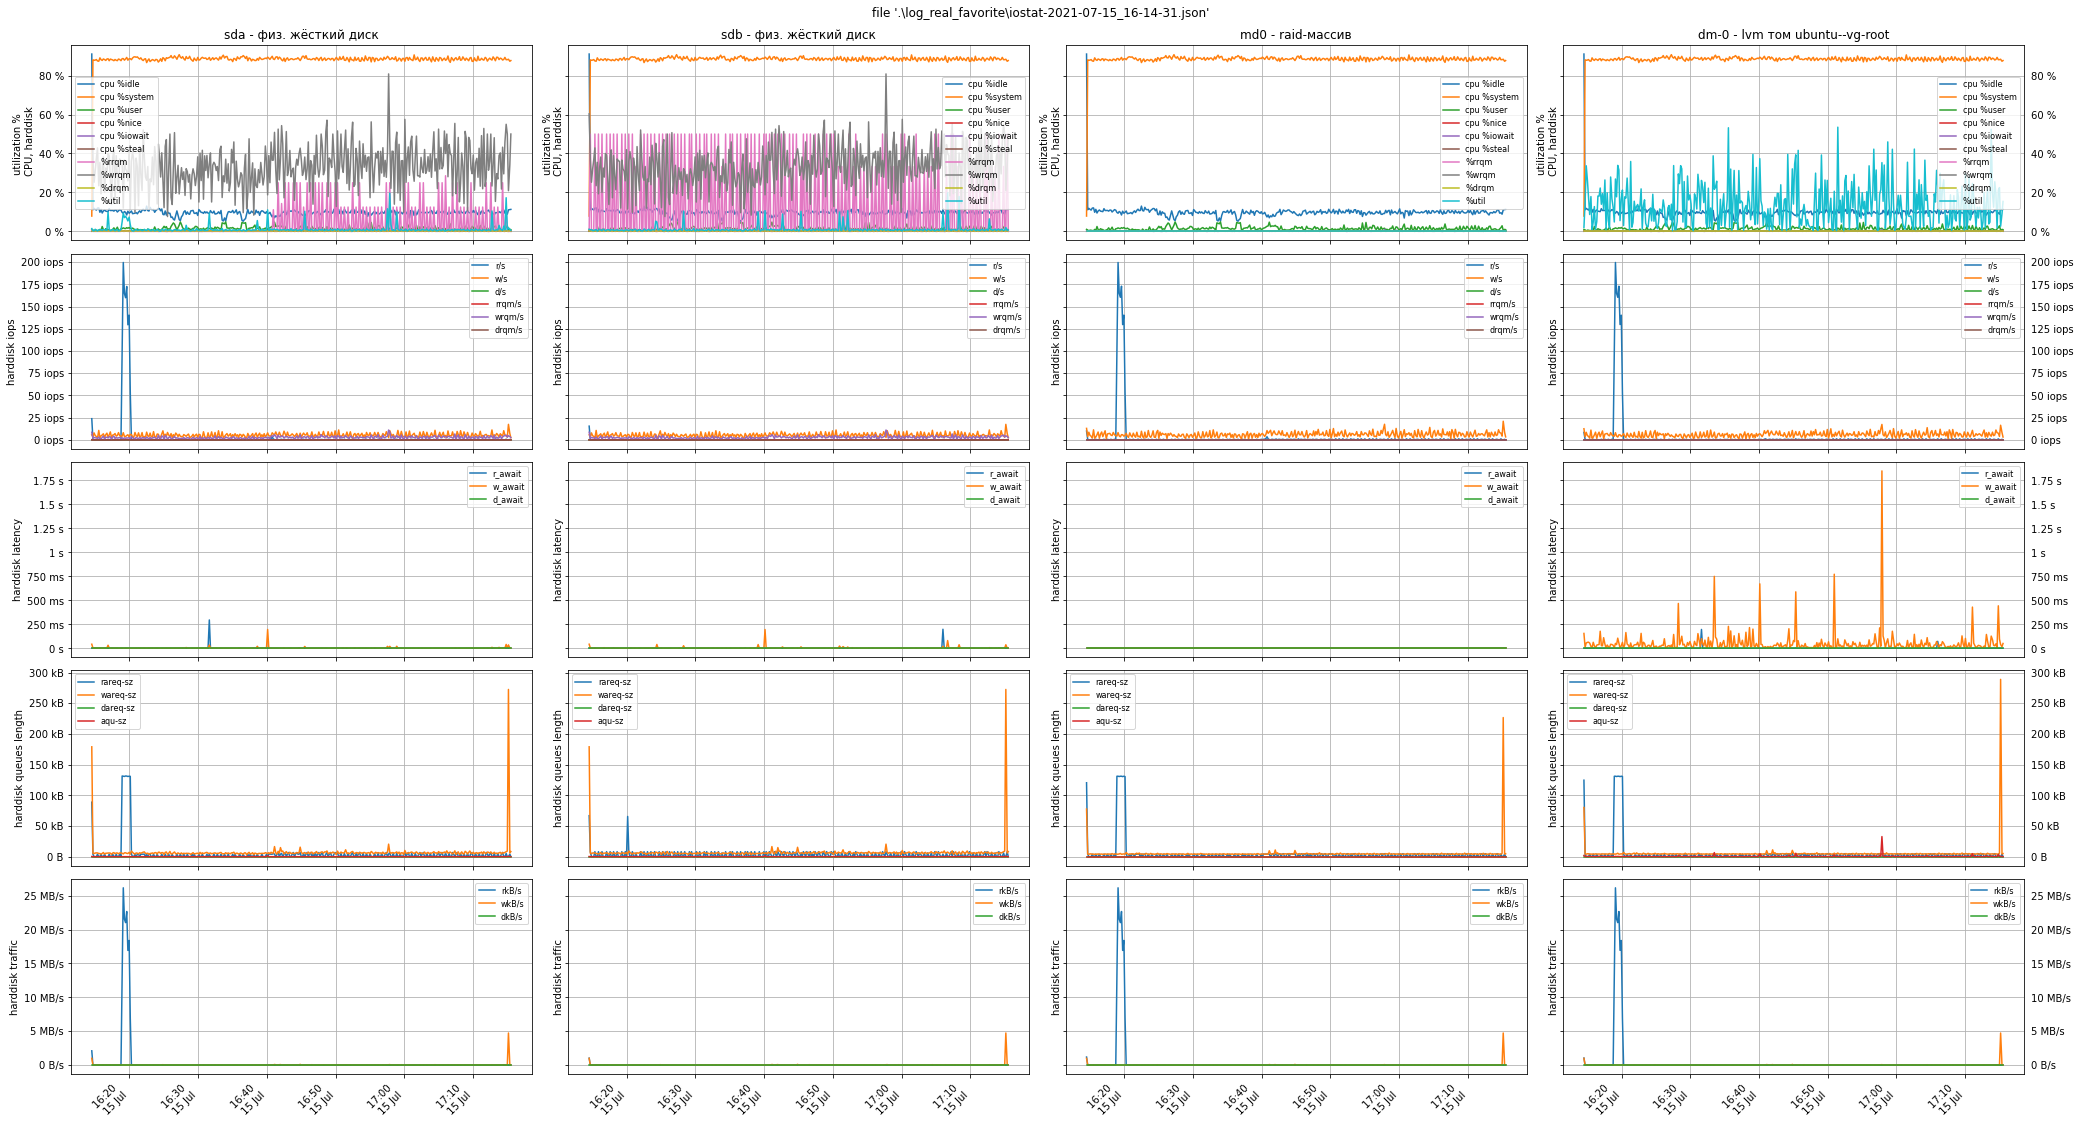
And below are the graphs from a real ticket diagnostic case from a real customer. There was no need to stop operation to turn on the test load: the graphs clearly show peaks of 40 iops per write and 200 iops per read, i.e. problems with the disk subsystem were not detected, the disks were not nearly full, and the low performance is caused by a completely different reason.
Above, we advised you to pay attention to the Load Average indicator and take screenshots of the utility top or htop. The meaning of this indicator, converted to one processor core, is as follows:
- la < 1 - the system still has free computing resources, there is no process queue
- la = 1 - no resources, no queue at the moment
- la > 1 - there is a queue where processes are waiting for CPU resources to be released for their execution
Keep this value between 0.7 and 0.8: on the one hand there is still some free resources available, and on the other hand the CPU utilization is rather good. In this case la = 80 / 32 = 2.5.
This was the reason for low software performance: the queue of processes waiting for execution was 1.5 times longer than the one already executed on the CPU -> the load was 250% -> the software was "slow".
List of useful materials
briefly about iops limit trolling https://communities.vmware.com/t5/vSphere-Hypervisor-Discussions/After-apply-the-DISK-IOPS-limit-my-storage-latency-increased/m-p/1344871/highlight/true#M2945
VMWare article on limiting mechanisms https://core.vmware.com/blog/performance-metrics-when-using-iops-limits-vsan-what-you-need-know
VMWare official documentation https://core.vmware.com/resource/vsan-operations-guide#sec6732-sub5
why limits are necessary https://www.vmgu.ru/news/vmware-vsphere-virtual-disk-vmdk-iops-limit
Presentation on mClock algorithm - hypervisor IO scheduler, including storage management https://www.usenix.org/legacy/events/osdi10/tech/slides/gulati.pdf
fio official documentation https://fio.readthedocs.io/en/latest/fio_man.html#fio-manpage
official iostat documentation http://sebastien.godard.pagesperso-orange.fr/man_iostat.html
