S3 billing is calculated based on three primary parameters:
-
Storage used (amount of data stored)
-
GET/HEAD requests (data retrieval and metadata operations)
-
PUT/POST requests (data upload operations)
You can review detailed usage analytics through the S3 Storage Control Panel at:
https://cmc.objstor.cloud4u.com:8443/
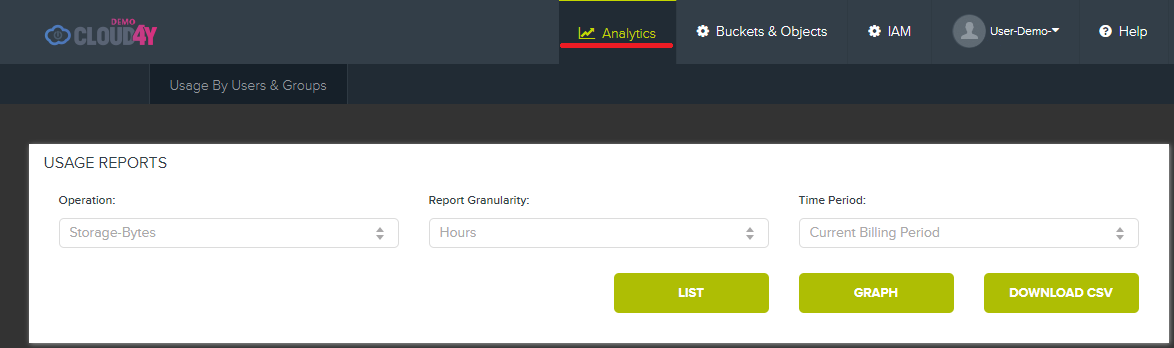
After logging in with your credentials, navigate to the Analytics tab.
Note: The Analytics view differs between a group administrator and a standard user.
Analytics Tab Overview
Standard User View
Standard users can only view usage data for their own account.
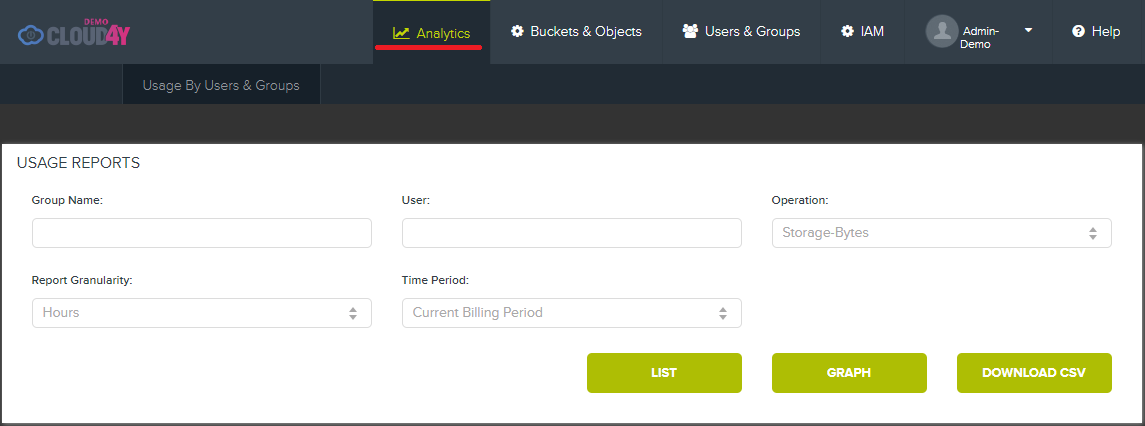
Group Administrator View
Group administrators can filter analytics by Group Name and User, allowing detailed tracking across multiple accounts.
Filtering and Report Options
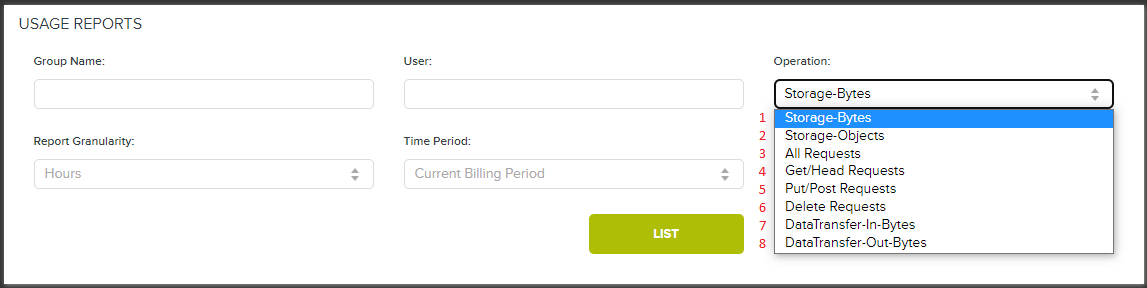
Operation Types
Select a specific metric from the Operation dropdown:
| Operation | Description |
|---|---|
| Storage-Bytes | Storage space used (in bytes) |
| Storage-Objects | Number of objects stored |
| All Requests | All request types combined |
| Get/Head Requests | GET and HEAD requests only |
| Put/Post Requests | PUT and POST requests only |
| Delete Requests | DELETE requests only |
| DataTransfer-In-Bytes | Inbound data transfer (bytes) |
| DataTransfer-Out-Bytes | Outbound data transfer (bytes) |
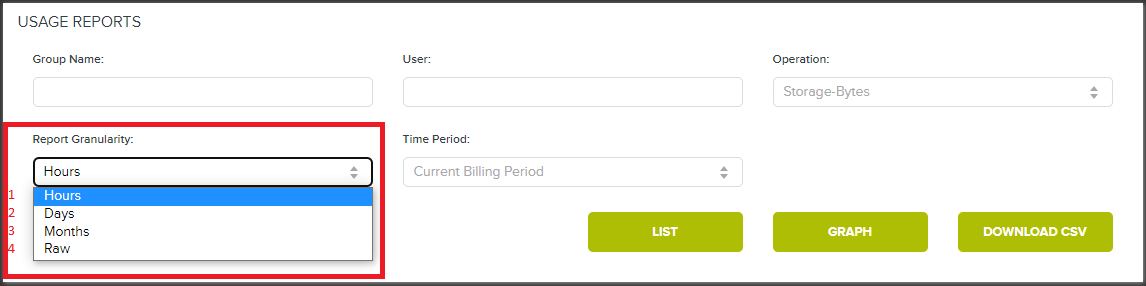
Report Granularity
Choose the time detail level:
-
Hourly – Detailed hour-by-hour breakdown
-
Daily – Aggregated by day
-
Monthly – Aggregated by month
-
Daily Range – Custom daily aggregation
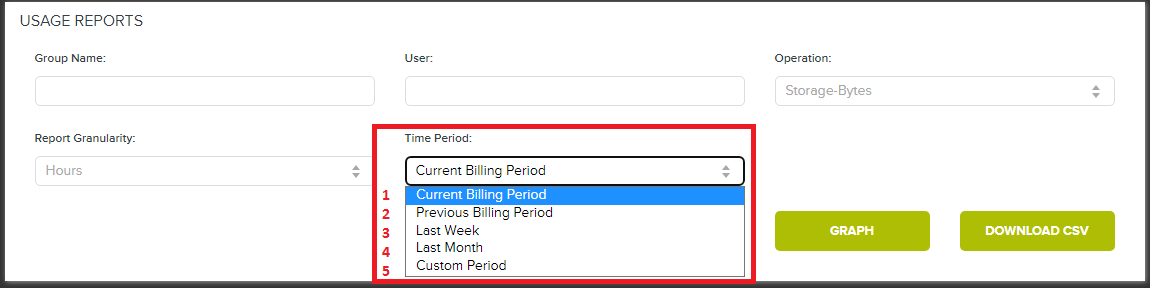
Time Period Selection
Filter by predefined or custom date ranges:
-
Current Billing Period
-
Previous Billing Period
-
Last Week
-
Last Month
-
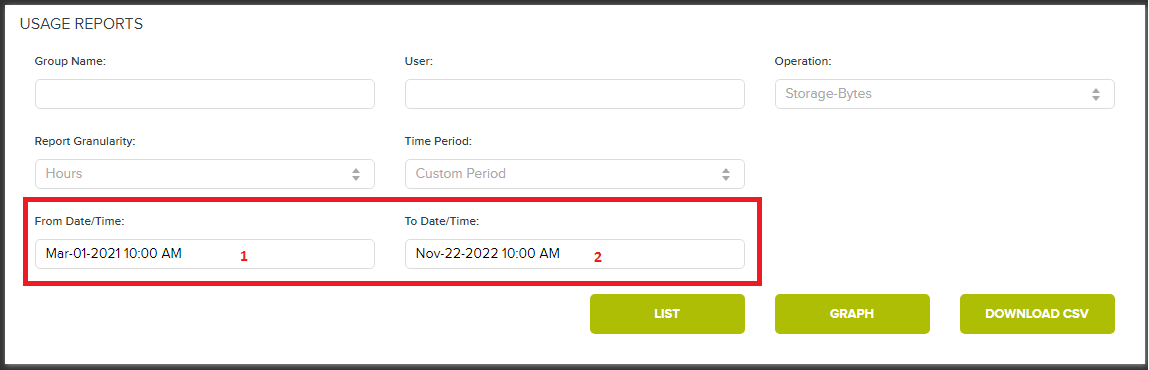
Custom Period – Select any start and end dates
Generating Reports
Once filters are set, generate your report in one of three formats:
-
Table View – Tabular data format
-
Graph View – Visual chart representation
-
Download CSV – Export data as CSV file
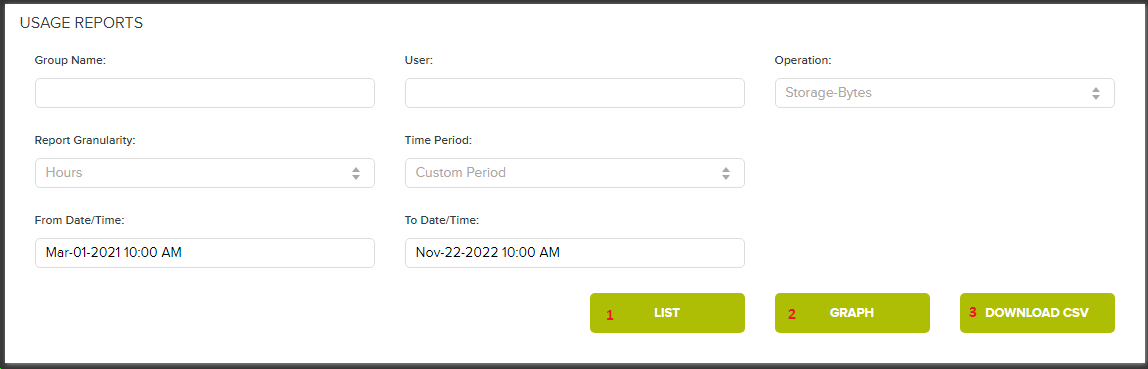
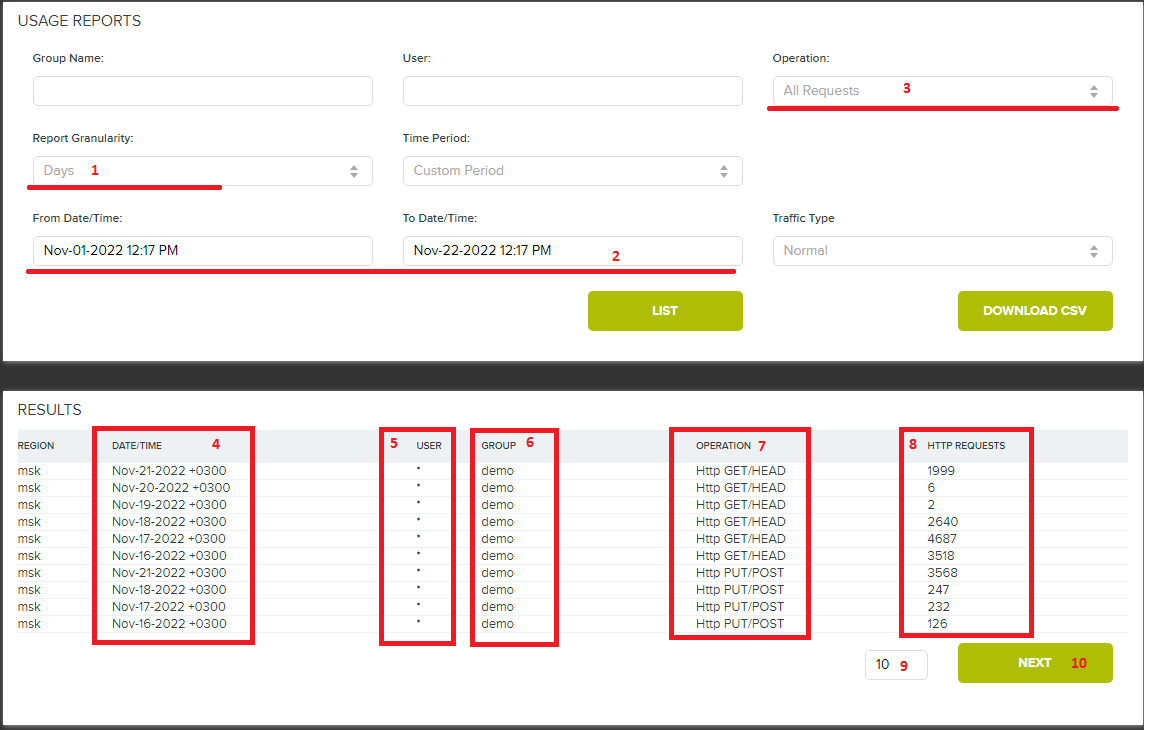
Table Report Example
Filter: Daily granularity, All Requests, Nov 1–22, 2022
Use the pagination controls at the bottom to navigate through multiple pages.
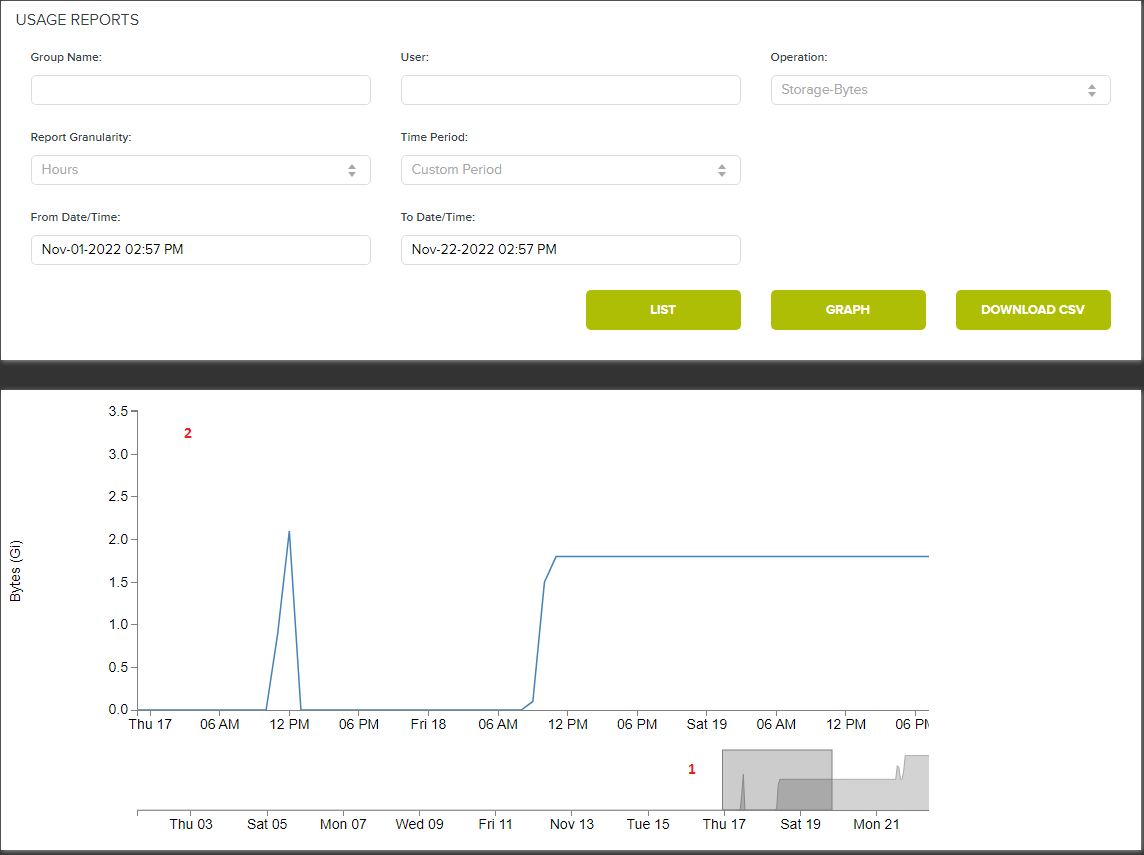
Graph Report Example
Filter: Hourly granularity, Storage-Bytes, Nov 1–22, 2022
-
The lower graph shows the entire period
-
Hover or click to zoom into specific time ranges (detailed view appears above)
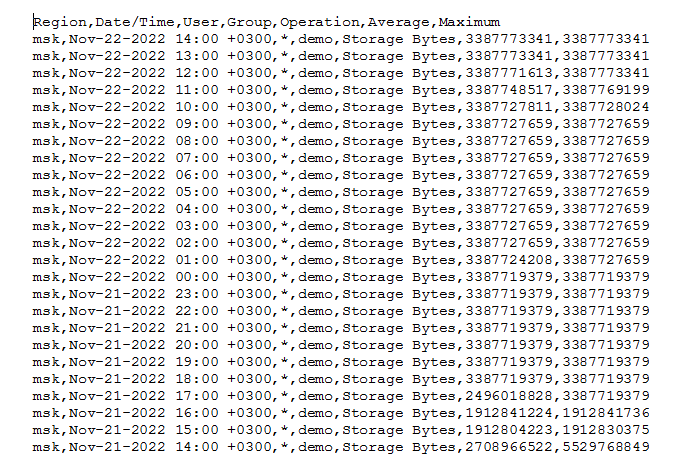
CSV Export
Click Download CSV to save the report locally. Open with any spreadsheet application: